Challenge:
In a small city, there lived a developer named as Dax. And his boss name was Gabe. Their main goal was to develop a faster running websites and have happy clients! (So, as you!?) And they were best in the town to deliver faster running websites!
One fine morning, they faced a challenge. And this blog post is about how they overcome that challenge.
Disclaimer — All characters in this publication are entirely fictitious and any resemblance to real persons, living or dead, is purely coincidental.
Solution:
Read it from left to right
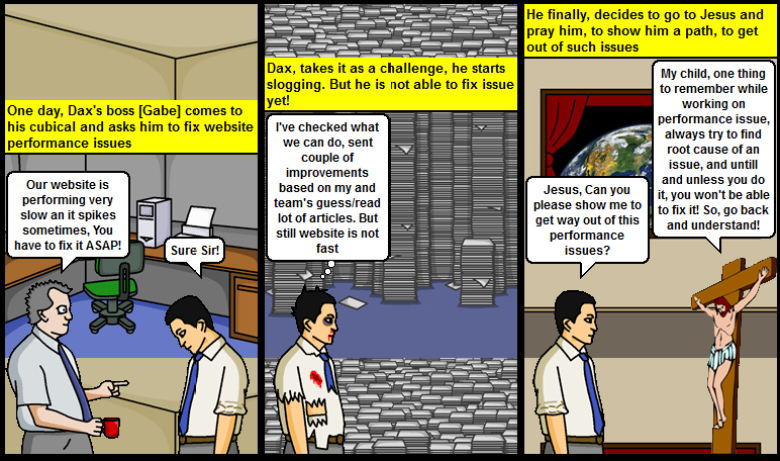

Gabe asked Dax to fix, their ASP.NET website performance issue and while working on it, Dax made a mistake, which most of us (Including me) make, it is fixing a performance issue by blindly guessing the things along with worse part, making code change which “they think” it is causing slowness! But this “stab in the dark” method doesn’t work most of the time! [Just a note : I believe that don’t fix any issue, until and unless you’ve reproduced it or understood it thoroughly, If you do it without understanding it, you never know when it will come back to you! But surely, it will!]
Y’day night Dax, sent me an e-mail and asked to share his and his team’s performance learnings with you! [You know, Jesus requested him to share his learnings with you? How honest, Dax is!]
Whatever stuff, you work on, If you follow W (What)- W (Why)- H (How) theory you can solve anything!
What are Website Performance standards?
Have seen lot of people who work on performance issues, without having a measures [Statistics and numbers are your best friends while working on performance! Because if you can’t measure anything, you haven’t improved it yet!]. How fast is really fast? [Carpentry quote : Measure twice, cut once!]
So, here are some numbers, which Dax came across while doing research and reading on website performance standards blogs and articles:
Before, we move on, let’s have a look at, good to know terminologies:
- Response time of your server : The time taken, by server to process your request, it includes time taken by Database call, File IO Operation, Time taken by .NET CLR, Request Queuing etc.
- TTFB : Time to load first byte, this is the time when browser requests HTML of your page, and server builds your whole page’s HTML to browser, and after that browser starts rendering of your page by requesting other resources like CSS/JS/images etc.
- Page Load time : This is the total time taken by your browser to completely load a page.
So, to ensure that your site is performing as per web standards, check following values for your website (Just a note : these values are standard values, it might not fit in to your environment. so, do understand your environment before you start investigating performance issues):
- TTFB should be <= 100 Milliseconds; Because if it is high then your users will see a white browser page, and nothing will get loaded until and unless it receives first HTML data from server.
- Response Time should be <= 2 seconds
- Start Render Time should be <= 2 seconds
- Page Load time should be between 2-3 seconds
Now, you must be curious to know, how we can check these values? Going at each layer, and checking logs at each level or there is a smart way? Luckily, there is a smart way available for you! We will have a look at it in “How” section soon!
Good to read:
http://www.webperformancetoday.com/2012/02/13/non-geeky-guide-to-performance-measurement/
http://www.webperformancetoday.com/2010/06/15/everything-you-wanted-to-know-about-web-performance/
Why Website Performance matters?
http://www.strangeloopnetworks.com/resources/infographics/web-performance-and-user-expectations/poster-visualizing-web-performance/
http://www.webperformancetoday.com/2012/03/21/neuroscience-page-speed-web-performance/
Above articles nicely explained everything!
In summary, just take a case, that if you got 20 Million visitors per month, and if your website is slow by just 1 second, then 20*1= 20 M seconds gets wasted, which they can spend somewhere else — with their family, friends or If you are running e-commerce, website then they might place multiple orders because of your faster running website! 🙂
And as per research, in this impatient era, where everyone wants everything to be done instantly [5G!], If your site is running slow, then people will not complaint you about it. But they will go to your competitor.
How to Improve Website Performance?
Now, how to measure, these values, there are smart tools available, which you can use to know your website’s performance values, we will categorize it in two categories, Server-Side and Client-Side:
Performance problem can be divided mainly in two categories:
- Serve-Side : If your server is not serving requests faster, then your website is suffering from server-side/back-end performance issues. Server-Side performance issues, are really very tough to find. Because in most of the cases, you will not have a specific scenario to reproduce, You will not have Visual Studio on live server, where you can debug your code! :-). But thanks to APM tools, Performance counters, Log4Net, DebugDiag and WinDbg – these are the tools who will help you to fix your back-end issues!
- Client-Side : If your website is not using minify/merge than it falls in client-side/front-end performance issues, Because server has sent response rapidly. But client [Browser] is taking time to render a page, and it happens if you are not following performance best practices while building your website. It is also known as “Front-End” time. And as per stats. “80-90% time goes in front-end!”. So, If you’ve faster servers, But if your front-end is not following performance rules, then your site will never get loaded faster!
Server-Side performance testing tools:
- APM Tools– APM stands for Application performance management, there is lot of APM tools available in market. You need to install their lightweight agent on your server, that’s it! It will report you everything via a nice web-based dashboard! But Dax’s favorite is, and tried one is New Relic [It’s costly. But worth! — Indeed “A web & mobile Developer’s Best Friend”]: http://newrelic.com/
- Profiling – You can run profiling tool on your website, mostly in local, this tool will help you to find performance issues. It mostly helps when you’ve specific scenario to reproduce. For unknown scenarios it doesn’t help much, again Dax’s favorite is ANTS Performance Profiler from Rad Gate — http://www.red-gate.com/products/dotnet-development/ants-performance-profiler/
- Performance Counters – “Performance counters is your computers Google” Nice quote from Performance webinar, Just add performance counters [Which one to add, how to analyze that something we will see in upcoming posts]
- DebugDiag and WinDbg — Using performance counter, If you found that there is a memory leak in your application or when Request Queuing goes high your application goes slow. And now, you would like to see what is there in heap when such thing happens — then DebugDiag and WinDbg are your friends! — http://blogs.msdn.com/b/tess/archive/2008/02/04/net-debugging-demos-information-and-setup-instructions.aspx
Have Dax missed anything? Just feel free to comment!
Client-Side performance testing tools:
- WebPageTest.Org — www.webpagetest.org
- Pingdom Tools — http://tools.pingdom.com/
- Google PageSpeed Tools — https://developers.google.com/speed/pagespeed/
- Browser based tools — YSlow, HttpWatch, Firebug
Have Dax missed anything? Just feel free to comment!
Good to read:
http://yslow.org/user-guide/
http://www.webperformancetoday.com/2010/07/09/waterfalls-101/
http://www.stevesouders.com/blog/2012/10/09/webperfdays-performance-tools/
http://blog.newrelic.com/2012/09/04/improving-site-performance-with-yslow/
Still this point of time, we’ve seen how to delve in to performance issues more and find out, where you need to focus on server-side or client-side or BOTH.
Now, let’s have a look at “How” to solve them
- Client-side/Front-End site performance issues are relatively easy to find and fix! Just use any tool, follow the given rules, re-test and you are done!
- Server-side/back-end performance issues are relatively complex to find out, and once you found it fixing them might be easy! But finding back-end issue involves following level of understanding:
- Basics of ASP.NET — You must be saying this guy is crazy, come on, we are ASP.NET Professional and we’ve lot of years of experience, how ASP.NET works, we’ve developed and deployed lot of websites, And you are asking us to learn ASP.NET Basics? I agree with your thoughts, and I know you guys are experts in this field. But ASP.NET is a big topic, and when we develop something we work on more abstract layer, just drag and drop control. add some code behind stuff and we are done! But to work on performance stuff, you need to know lot of ASP.Net Internals, Like How ASP.NET spawns worker threads? What is HttpApplication? What is HttpModule? What is co-relation between them? When HttpApplication instance gets created? How many requests your ASP.NET application can handle? What is Request Queuing? What is Request Queued? What is Contention? You know Thread agility issue? Lot of questions correct, bouncer? Don’t worry Dax also had same questions. But after investing sometime he learnt it, and he will share those learnings with you in upcoming posts!
- Basics of Performance counters – Counters are your best friends! Just do learn some basics of performance counter, introduce yourself to them and vice-versa! These guys will tell you lot of secrets! (So, as your best friend!)
- Basics of IIS Tools : IIS got plenty of nice tools, like FRT [Failed Request Tracing] which will help you to see what is going on?
- Basics of Performance Testing Tools : Before fixing anything on live server, do measure it locally, and you will need performance testing tools like JMeter,WCAT,ACT,AB.exe etc. Keep them handy!
- Basics of APM : As discussed earlier, good to have APM tool in your armory!
- Basic of Dump analysis : When no one helps you, and disappoints you. Dump is a light of hope, and it won’t disappoint you for sure!
Will expand these topics in upcoming posts! So, just keep visiting, Keep reading, And if you’ve good explanation of any topic listed here, do share with us! So, as Dax! 🙂
Good to read links:
http://www.webperformancetoday.com/2013/01/31/web-performance-101-developers/
http://www.red-gate.com/products/dotnet-development/ants-performance-profiler/entrypage/avoid-find-fix-asp-problems
http://www.softdevtube.com/2013/01/15/ten-web-performance-tuning-tricks-in-60-minutes/
http://stackoverflow.com/questions/4310719/asp-net-processmodel-configuration
http://www.guidanceshare.com/wiki/ASP.NET_2.0_Performance_Guidelines_-_Threading
http://www.aspnet101.com/2010/03/50-tips-to-boost-asp-net-performance-part-i/
Now, Dax and Gabe are really happy and they are enjoying their time! I’m sure they will keep sharing such things with us!
Have a happy faster running websites! 🙂
really interesting staff. Thank you! Fatih Yarbaşı.